
Qt Debugging & Profiling
Qt Debugging & Profiling – The developer experience with productivity at its core. From development through to testing and maintenance Qt’s got you covered for every step in your product life-cycle. Learn more about our tooling to debug and profile your applications. Qt Quick Compiler: • Compile QML source code into native machine code • Faster start up time & UI performance • Protect your source code and intellectual property Qt Quick Profiler: • Advanced performance analysis of your application • Identify and fix performance bottlenecks • Remote debugging & profiling Clang Static Analyzer: • Find issues by source code analysis • Identify bugs before your customers do Qt Test Runner • Build and run autotests for your projects • Make unit testing part of your development process • Ensure high quality code Visit www.Qt.io to learn more about Qt.
Oh, here is more

On-Demand Webinar: Designing for Real-World Devices: Why Is It a Field of Its Own and How Qt Is Tackling the Most Complex Design Challenge
In this keynote, we discuss UX design for real-world devices and why we believe it needs solutions t...
Watch Video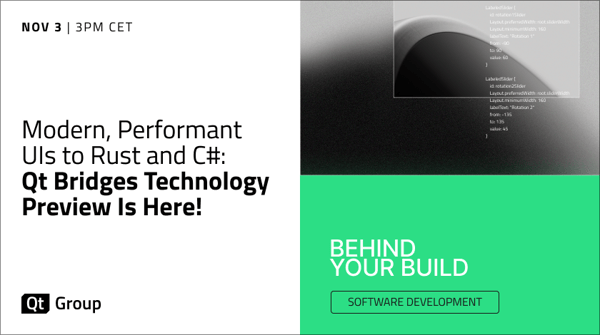
On-Demand Webinar: Modern, Performant UIs to Rust and C#: Qt Bridges Technology Preview Is Here!
Qt Bridges brings Qt to the languages your team already writes. This session covers the project and ...
Watch Video
On-Demand Webinar: How Medical Software Teams Break The Regulatory Bottleneck
Every medical device you ship needs a decade of security updates, maintenance, and regulatory upkeep...
Watch Video
QtWS26: Customer Voices SAUTER
Qt World Summit 2026 Customer Voices Interview with SAUTER
Watch Video